

Short answer: On Instagram, "Navigation" is the section of Story insights that counts how people moved through your Story: taps Forward, taps Back, swipes to the Next story, and Exits. The Navigation number at the top is simply the sum of those four actions. It tells you where attention held and where it was lost, slide by slide.
Key Takeaways
- Navigation = Forward + Back + Next story + Exited. It is a total of actions, not a count of people.
- Back is the strongest positive signal: someone wanted to see the previous slide again.
- Next story is the clearest negative signal: the viewer left your Story for another account.
- Forward is neutral on its own: it is how most people read Stories. Judge it as a rate, next to the slide before and after.
- Compare rates, not raw numbers: divide each action by the reach of that slide.
You post a Story, open the insights a few hours later, and see a line that says Navigation: 412. Underneath it there are four smaller numbers. Nothing on the screen explains whether 412 is good, bad, or just large. This guide explains what each of those numbers means, how to turn them into rates you can compare, and what to change in your Stories and Story ads when a number looks wrong.
Where to find Navigation in Instagram insights
Navigation is only available for Stories, and only on professional accounts (business or creator). Personal accounts do not get Story insights.
- Open your Story while it is live, or go to Profile > Insights > Content you shared > Stories for older ones.
- Swipe up on the Story, or tap the insights icon in the bottom-left corner.
- Scroll past Overview and Interactions to the section named Navigation.
Instagram renames and reorders the insights screens from time to time, so the exact path may look slightly different on your app version. The four metrics themselves have stayed the same.
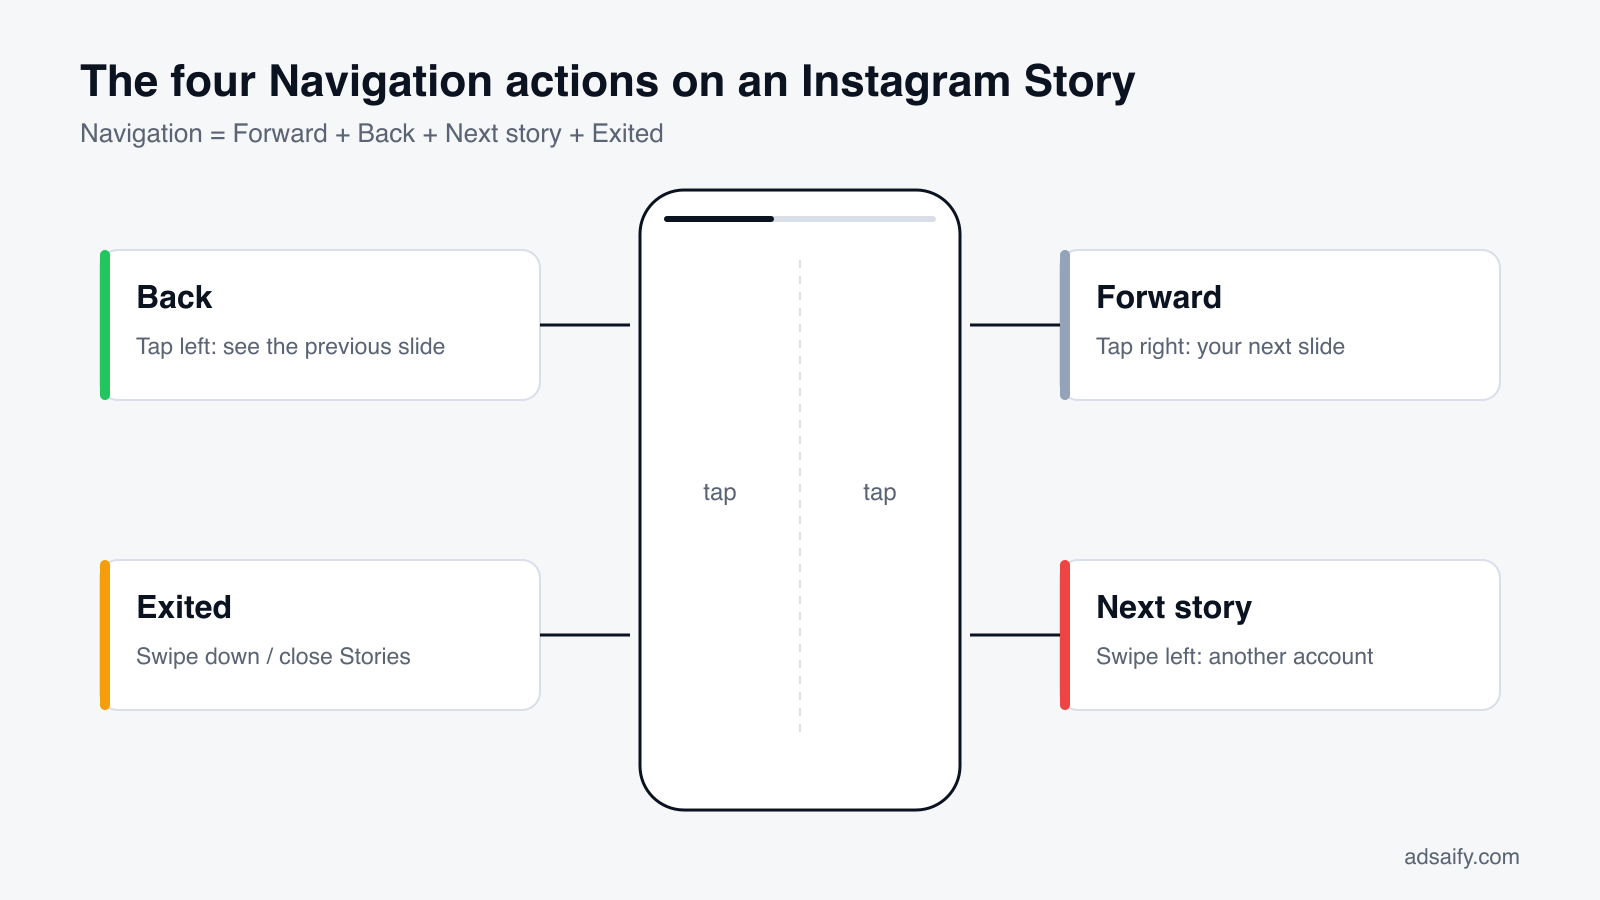
The four Navigation metrics, one by one
| Metric | What the viewer did | How to read it |
|---|---|---|
| Forward | Tapped the right side of the screen to go to your next slide | Neutral. Normal reading behaviour; worrying only when it is much higher than on your other slides. |
| Back | Tapped the left side to see the previous slide again | Positive. Something was worth a second look. |
| Next story | Swiped to skip the rest of your Story and move to another account | Negative. They chose to stop watching you. |
| Exited | Closed the Story viewer and went back to the feed or left the app | Mixed. Sometimes boredom, sometimes they got what they needed, sometimes life interrupted. |
Forward
A Forward tap means the viewer stayed inside your Story and moved on to your next slide. People tap forward constantly; it is the Story equivalent of scrolling. A high Forward count on a photo slide with one line of text is expected, because it takes a second to read. A high Forward rate on a 15-second video is different: it usually means the first two seconds did not give people a reason to stay.
Back
A Back tap means the viewer returned to the slide before the one they were on. People do this when they missed a detail: a price, a date, a discount code, a recipe step, a piece of text that disappeared too fast. If one slide collects far more Back taps than the rest, either it is your most interesting slide or the slide before it moved too quickly. Both are useful to know.
Next story
Next story means the viewer swiped left to leave your sequence and watch someone else. Unlike Forward, this is a decision about your account, not about one slide. Look at which slide it happens on. A spike on slide one points to a weak opening. A spike in the middle usually marks the point where the Story turned into a sales pitch or lost its thread.
Exited
Exited means the viewer closed Stories entirely. It is the hardest number to interpret, because it includes people who were bored and people whose bus arrived. One exception is always worth separating: on the last slide of a Story, an exit is often just the natural end of a session. Judge exits on your early and middle slides, not on the final one.
What is the "Navigation" total?
The number next to the word Navigation is the four metrics added together:
Navigation = Forward + Back + Next story + Exited
Two things follow from this. First, it counts actions, not people: one viewer who taps back and then forward adds two. Second, a higher Navigation total is neither good nor bad. A Story seen by ten times more people will have roughly ten times more navigation. The total only becomes useful once you break it apart and divide by reach.
Turn the numbers into rates
Raw counts cannot be compared between Stories with different reach. Convert them:
- Forward rate = Forward ÷ accounts reached on that slide × 100
- Back rate = Back ÷ accounts reached × 100
- Drop-off rate = (Next story + Exited) ÷ accounts reached × 100
- Completion rate = reach of the last slide ÷ reach of the first slide × 100
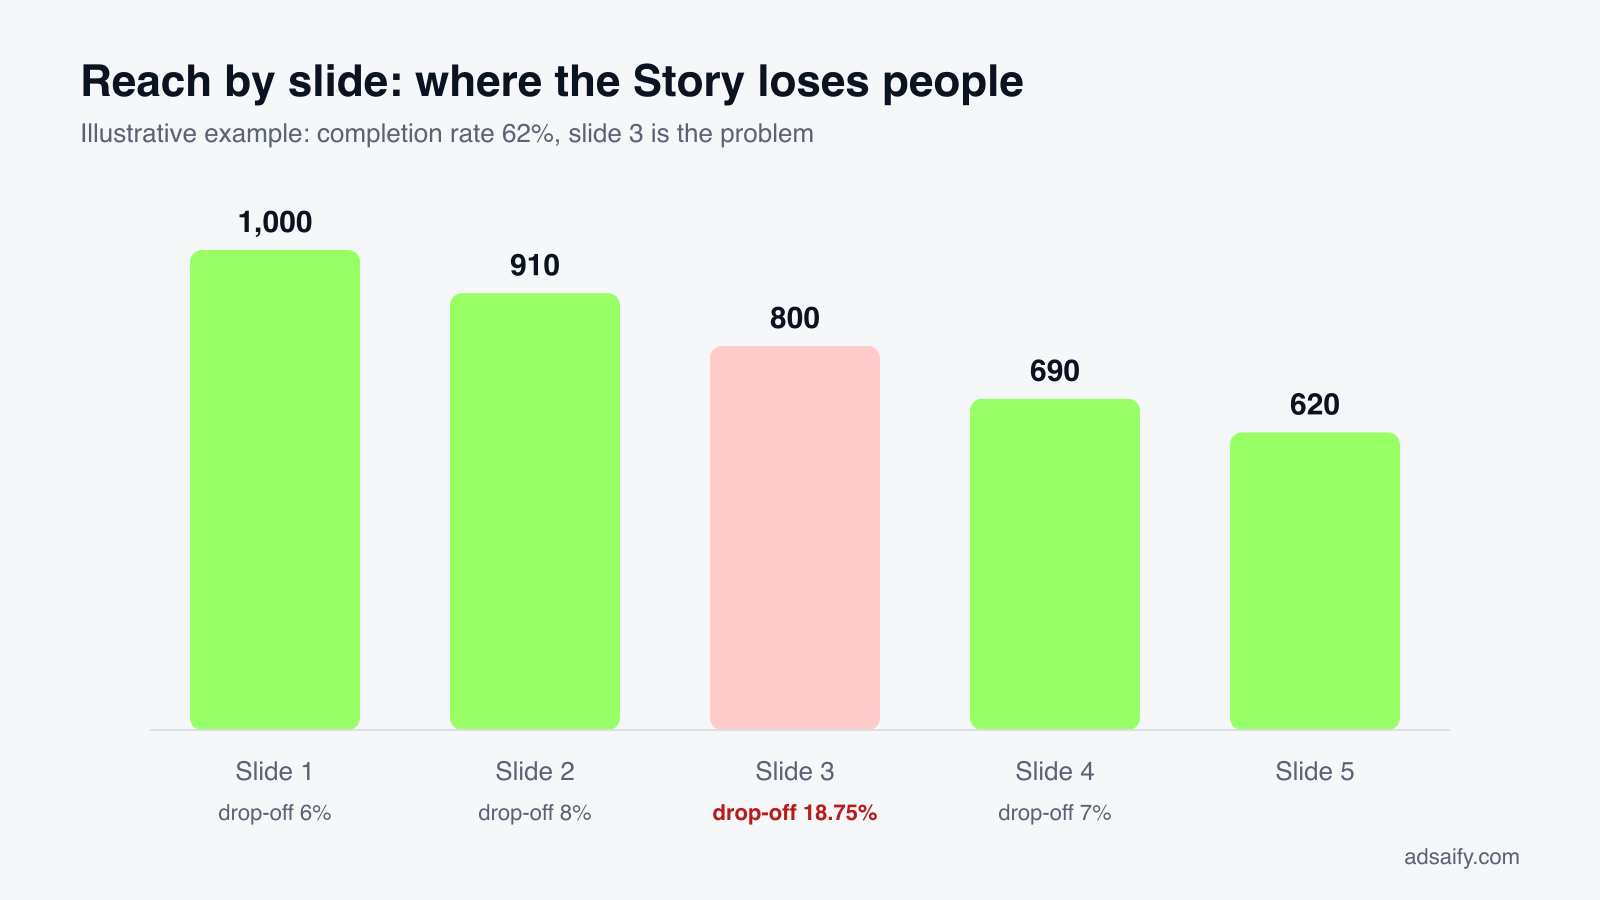
Worked example. A five-slide Story starts with 1,000 accounts reached and ends with 620. The completion rate is 62%. On slide three, 90 people swiped to the next story and 60 exited, out of 800 who reached it: a drop-off rate of 18.75%, against 6–8% on the other slides. Slide three is where the Story lost people, and it is the only slide that needs rewriting.
There is no universal "good" number, because completion depends heavily on how many slides you post and what kind of account you run. The benchmark that matters is your own average over the last 20–30 Stories. Build that baseline first, then look for slides that sit far above or below it.
Navigation is not the same as Interactions
These two sections sit next to each other and are often confused.
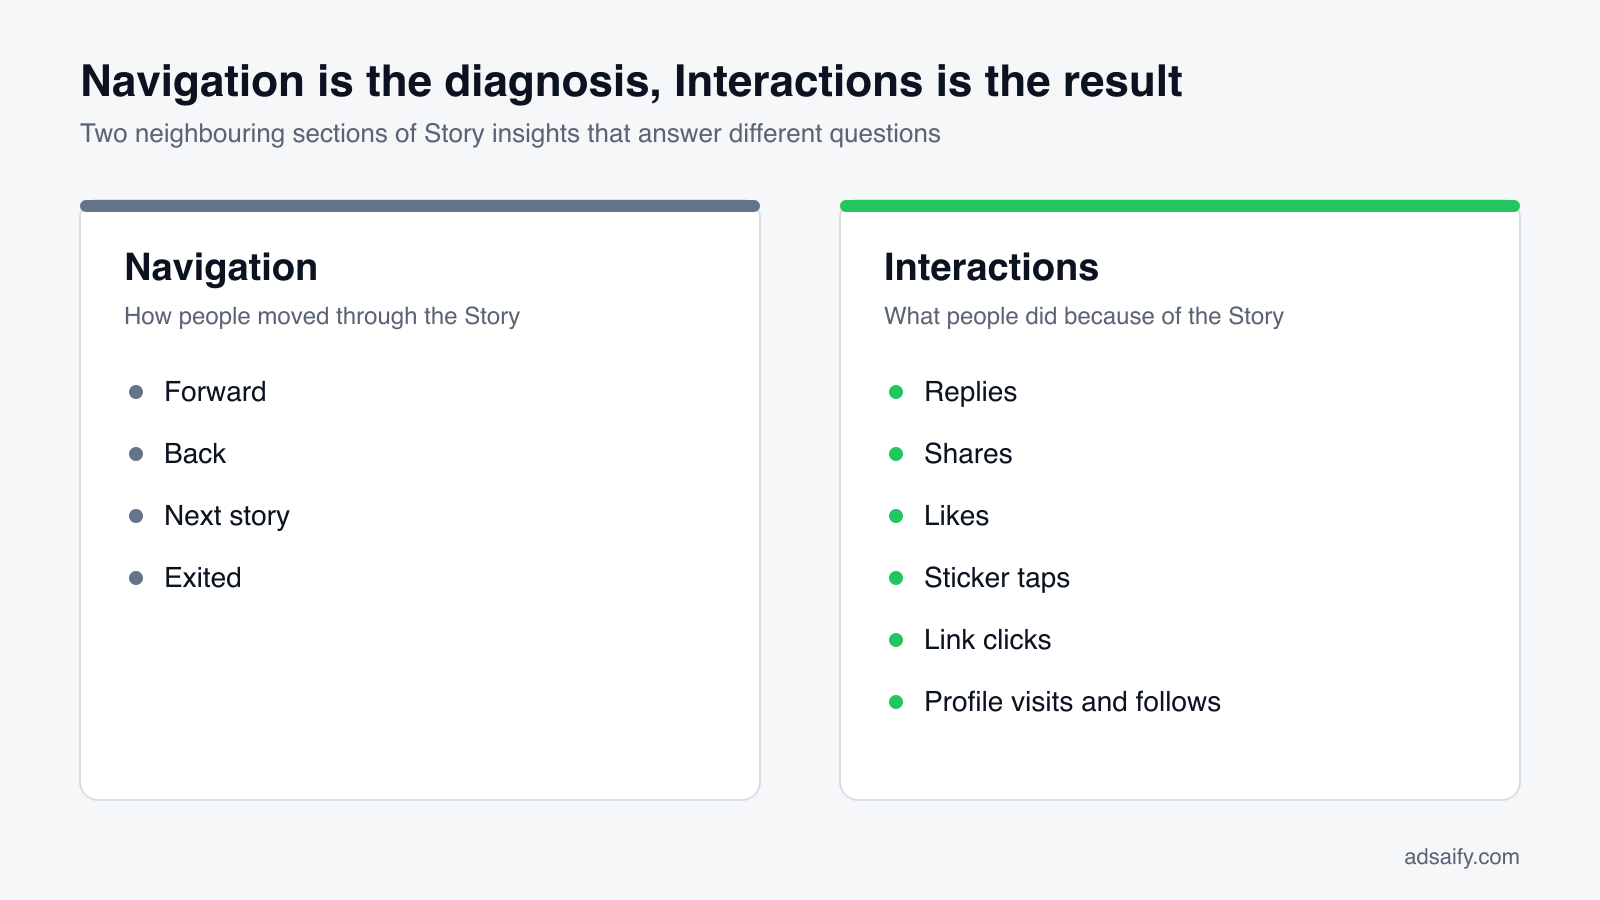
- Navigation counts movement through Stories: forward, back, next, exit.
- Interactions counts actions taken because of the Story: replies, shares, likes, sticker taps, link clicks, profile visits and follows.
A Story can have unremarkable navigation and strong interactions; that is a Story that did its job. If your goal is clicks or replies, Interactions is the result and Navigation is the diagnosis.
How to improve your Navigation numbers
If Forward is unusually high
- Put the point of the slide in the first second. Do not open with a logo or a slow fade.
- Cut text. If a slide needs more than two short lines, split it into two slides.
- For video, start with movement or a face, and add captions; many people watch with sound off.
If Next story is high on the first slide
- Open with the most specific thing you have: the result, the price, the before-and-after. Save context for slide two.
- Avoid starting with "Hey guys" or an announcement that an announcement is coming.
If Exited climbs in the middle
- Shorten the sequence. Five strong slides beat twelve average ones.
- Give people something to do: a poll, a question, a slider. Interactive stickers break the passive rhythm.
If you want more Back taps
- Use "tap back if you missed it" on slides with a code or a list.
- Split one idea across two slides so the second pays off the first.
What is the difference between Forward and Next story?
These two are confused more often than any other pair, because both move the viewer "onwards". The difference is where the viewer ends up.
| Forward | Next story | |
|---|---|---|
| Gesture | Tap on the right side of the screen | Swipe left across the screen |
| Where the viewer goes | Your next slide | Another account's Story |
| Are they still watching you? | Yes | No |
| What it says | "I have seen enough of this slide" | "I have seen enough of this account for now" |
| What to fix | The slide: pacing, text length, opening second | The sequence: order, length, relevance |
What does Forward mean on the last slide?
On the final slide of your Story there is no "next slide" of yours, so a tap on the right side takes the viewer to the next account. Depending on the app version this can be reported as Forward or as Next story, which is one reason the last slide's numbers should not be compared with the others.
Can a swipe be accidental?
Yes. People hold phones with one hand and scroll with a thumb, so some swipes and taps are slips. This is noise that every account has in roughly the same proportion. It matters only when your reach is very low: with 40 viewers, three accidental swipes move the rate by several points. Do not draw conclusions from a single Story with fewer than a few hundred accounts reached.
What are normal Navigation numbers? Benchmarks from published reports
Instagram does not publish averages, but several analytics companies do, based on large samples of brand accounts. They are useful as orientation, with one caution: each report defines its rates slightly differently, so compare your numbers to your own history first and to benchmarks second.
| Finding | Figure | Source |
|---|---|---|
| Exit rate for Stories with a single frame | about 14% | Rival IQ, 2024 Instagram Stories Benchmark Report |
| Exit rate once a Story has around five frames or more | levels out near 5% per frame | Rival IQ, 2024 |
| Tap-forward rate on Stories longer than six frames | above 90% of viewers | Rival IQ, 2024 |
| Sample behind those figures | more than 125,000 Stories and 539,000 frames | Rival IQ, 2024 |
| Average Story completion rate for brands | about 70% | Dash Social, Instagram Stories benchmarks |
Three practical conclusions follow from these figures.
- High Forward is normal. If nine in ten viewers tap forward on long Stories across thousands of brands, a high Forward count on your own Story is not a sign of failure. It is how the format is used.
- The first frame carries the most risk. The exit rate is highest on single-frame Stories and falls as people settle into a sequence. The opening slide deserves the most work.
- Exits per frame are small, but they add up. Losing 5% per frame leaves about 77% of the starting audience after five frames and about 60% after ten. This is the arithmetic behind the advice to keep sequences short.
Sources: Rival IQ 2024 Instagram Stories Benchmark Report; Dash Social Instagram Stories benchmarks.
Which other Story metrics should you read alongside Navigation?
Navigation explains movement. To judge a Story you need the numbers around it.
| Metric | What it counts | Use it to answer |
|---|---|---|
| Accounts reached | Unique accounts that saw the slide | How many people did this actually get to? This is the denominator for every rate. |
| Views / impressions | Total times the slide was shown, including repeats | Are people watching more than once? |
| Profile activity | Profile visits, follows and button taps that came from the Story | Did the Story make people curious about the account? |
| Replies | Direct messages sent in response to the slide | Did it start a conversation? |
| Shares | Times the slide was sent to someone else | Was it worth passing on? |
| Sticker taps | Taps on mentions, hashtags, locations, polls, questions and other stickers | Which interactive element worked? |
| Link clicks | Taps on the link sticker | Did it send traffic where you wanted? |
A useful way to combine them: reach tells you the size of the audience, Navigation tells you how much of the Story that audience watched, and Interactions tells you what they did about it.
How do you diagnose a Story from its Navigation pattern?
Most problems show up as one of a small number of patterns. Find yours in the table.
| Pattern | Likely cause | What to try |
|---|---|---|
| High Next story on slide 1 | The opening does not say why to stay | Lead with the outcome, the offer or the most striking visual |
| Reach falls steadily, slide after slide | The sequence is too long for the content | Cut to the five strongest slides; move detail to a caption or a link |
| One slide with a drop-off spike | That slide changes tone: a sales pitch, a wall of text, a slow video | Rewrite or remove that slide only |
| Very high Forward on a video slide | Slow start, no captions, or the point comes too late | Put the point in the first two seconds and add captions |
| High Back on one slide | Interesting detail, or text that vanished too quickly | Keep the idea; give it more time or split it across two slides |
| Good completion, no link clicks | People watched but were not asked to do anything clearly | One call to action, on its own slide, with the link sticker placed in the middle of the screen |
| High Exited on the last slide only | Normal end of session | Nothing; this is expected |
How many slides should a Story have?
There is no fixed answer, but the benchmark data gives a frame for the decision. Each extra slide costs a few percent of the audience, and the first slide costs the most. So the question is whether a slide adds more value than the viewers it loses.
- 1–3 slides: announcements, reminders, a single offer. The highest share of viewers sees everything.
- 4–7 slides: a short explanation, a product walk-through, a before-and-after. The best balance for most accounts.
- 8 or more slides: tutorials, event coverage, Q&A sessions. Expect to lose a large part of the audience by the end, and put the important message in the first three slides.
Whatever the length, put the call to action early as well as late. Many of the people who would have clicked will have left before the final slide.
How do you track Navigation over time?
Insights for an individual Story are only available for a limited period, so the habit that makes Navigation useful is writing the numbers down. A simple sheet is enough.
- Record — once a day, note reach, Forward, Back, Next story and Exited for the first and the last slide of each Story.
- Convert — calculate the completion rate and the drop-off rate for each Story.
- Baseline — after three or four weeks, calculate your own average for each rate.
- Flag — mark every Story that is well above or below the average.
- Compare — look at what the best and worst Stories have in common: length, opening slide, format, time of day.
- Change one thing — test a single change for two weeks, then compare with the baseline again.
Columns that are worth keeping: date, topic, number of slides, format of the first slide (photo, video, text), reach of slide one, reach of the last slide, completion rate, total Next story, total Exited, link clicks, replies. Ten minutes a week is enough to maintain it.
What are the most common mistakes when reading Navigation?
- Treating the Navigation total as a score. It rises with reach and with the number of slides. It says nothing on its own.
- Reading Forward as rejection. It is the default way of watching. Only an unusual rate on a specific slide means something.
- Comparing raw counts between Stories. A Story seen by 5,000 accounts will always have more exits than one seen by 500.
- Judging the last slide like the others. Everyone has to leave somewhere, and most leave at the end.
- Deciding from one Story. Day of the week, time of day and what else was in people's feeds all move the numbers. Look at ten Stories before changing your approach.
- Optimising Navigation and forgetting the goal. A Story with perfect completion and no replies, clicks or sales has not achieved anything.
If you would rather not prepare each of these steps by hand, try it in Adsaify: your first ad is free, so there is nothing to lose. Create a free account.
Navigation and Story ads
The Navigation section belongs to organic Story insights. Paid Story placements are reported in Meta Ads Manager with different metrics: impressions, reach, 3-second video plays, ThruPlays, link clicks, landing page views and results. The lesson carries over directly, though. A Story ad is one slide competing against a thumb that is already moving, so the same rules apply with less room for error:
- Design vertically at 1080 × 1920 pixels (9:16) and keep text and logos away from the top and bottom edges, where the account name and the call-to-action sit.
- Say what you sell in the first frame.
- Use one message and one call to action per ad.
- Test more than one creative; a single ad gives you nothing to compare.
If you would rather not build each version by hand, Adsaify reads your website, drafts the ad copy and creatives, and publishes the campaign to your own Meta ad account. Before publishing you can preview the same ad as a Feed post, a Story and a Reel, so you see how the vertical crop looks before you spend anything. Create a free account to try it.
Frequently Asked Questions (FAQ)
1. What does navigation mean on Instagram?
It is the part of Story insights that records how viewers moved through your Story. It adds up four actions: Forward, Back, Next story and Exited.
2. Is high navigation good or bad?
Neither. The total grows with reach. What matters is the mix: more Back taps and fewer Next story swipes is the healthy direction.
3. What does "Back" mean on an Instagram Story?
The viewer tapped the left side of the screen to see your previous slide again. It usually signals interest or a detail they wanted to re-read.
4. What is the difference between "Next story" and "Exited"?
Next story means they skipped to another account's Story. Exited means they closed the Story viewer altogether.
5. Does Navigation show who tapped forward or back?
No. Instagram shows totals only. You can see the list of viewers of a Story, but not which action each person took.
6. Why can't I see Navigation on my Story?
Story insights require a professional account, and they only cover Stories posted after the account was switched. Insights for a Story are also only available for a limited time after it was posted.
7. Do Reels and feed posts have Navigation?
No. Navigation is specific to Stories. Reels and posts report views, watch time, likes, comments, shares and saves instead.
How can you try this with Adsaify?
Adsaify analyses your business from your website address, drafts the campaign with an audience, ad copy, creative and a budget suggestion, and publishes it to your own Meta ad account once you approve.
- Your first ad is free: there is nothing to lose by trying.
- Your own ad account: the campaign runs in your Meta account and you stay in control.
- Preview by placement: see the ad as a Feed post, a Story and a Reel before it goes live.
Create a free account and try your first ad · Already have an account? Log in.