Short answer: To stop rising return rates when scaling Meta ads, brands must eliminate exaggerated discount messaging, depict precise sizing and product reality directly in ad creatives, and feed return-adjusted net purchase values back to Meta Pixel rather than optimizing strictly on gross front-end revenue that masks phantom profitability.
Scaling a Meta campaign often produces a deceptive victory. Your Meta Ads Manager dashboard reports an enviable return on ad spend (ROAS) and steady conversion volume, yet your warehouse is quietly filling up with returned merchandise. Orders spike during aggressive scaling phases, but two weeks later, customer support queues are overwhelmed with refund requests, and merchant cash reserves dry up despite seemingly stellar front-end performance.
This problem occurs because Meta's delivery algorithm prioritizes fast, impulse-driven buyers when budgets expand, particularly when ads rely on aspirational angles or aggressive discounts. Left unchecked, scaling on gross sales triggers severe hidden costs: unrecoverable forward and reverse shipping expenses, restocking labor, payment processing losses, and skewed attribution data that leads performance marketers to pour additional budget into campaigns that actively destroy net profit margins.
After reading this article, you will be equipped to diagnose the exact origins of post-purchase churn, isolate targeting mismatches from merchandise defects, and realign your acquisition strategy around retained revenue. We cover the technical tracking prerequisites, pre-purchase creative filters, and systematic weekly routines required to lower return rates while continuing to scale your Meta ad spend profitably.
Key Takeaways
- Optimize for net contribution margin after returns rather than inflated gross ROAS.
- Showcase realistic sizing and unedited fabric details in ad creatives to set expectations.
- Feed cancellation and return data back to Meta via offline Conversions API uploads.
- Exclude payment methods and delivery segments historically prone to chronic returns.
Why does scaling Meta ads trigger a post-purchase return surge?
Scaling Meta ads triggers a post-purchase return surge because algorithmic budget expansion pushes ad delivery beyond high-intent core buyers into broad audiences prone to impulse purchasing. Concurrently, hyper-saturated creative treatments establish unrealistic expectations, while the Meta delivery system optimizes strictly for front-end purchase events rather than downstream customer retention or product satisfaction.
Broad targeting reaches low-intent, impulse-driven consumers
When daily budgets increase, Meta's Advantage+ audience expansion leaves the small segment of warm, brand-aware users and serves impressions to cold prospects. Cold prospects exhibit significantly less patience and lower brand loyalty. Because these users buy on an emotional impulse triggered by frictionless native checkouts or mobile-optimized landing pages, they experience buyer's remorse quickly once the physical parcel arrives at their doorstep.
Creative embellishment creates an expectation gap
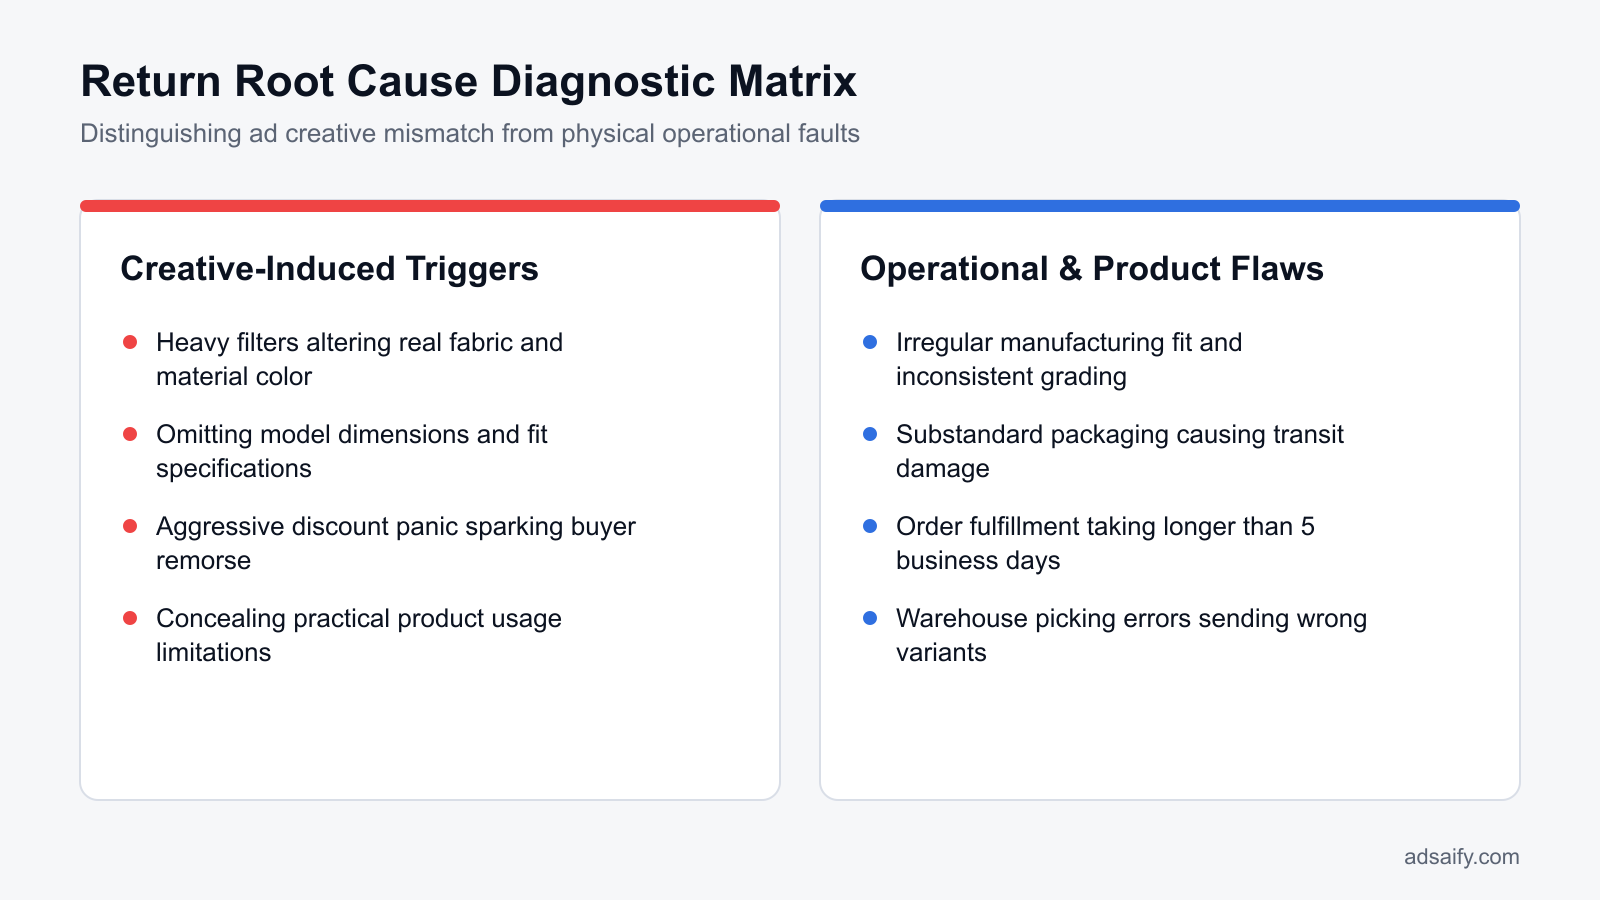
Performance creative production frequently relies on studio lighting, high-contrast digital filters, and flattering camera angles to maximize click-through rate. When an ad dramatically alters product hue, conceals fabric sheer, or hides structural stiffeners, the physical product inevitably fails to match consumer expectations. When setting up campaign concepts, advertisers can use Adsaify to draft realistic campaign angles from a store URL without relying on deceptive visual hooks that inflate return volume.
Meta optimization algorithms focus purely on gross checkouts
The standard Meta Pixel tracks the Purchase event, which records gross conversions at the instant payment succeeds. Unless an advertiser actively streams post-purchase cancellation and return data back into Meta Ads Manager via the Conversions API with adjusted monetary values, the optimization algorithm treats a returned order identically to a retained order. Consequently, the algorithm naturally directs spend toward demographic segments that convert easily on impulse, regardless of whether those shoppers routinely return parcels.
For example, an apparel e-commerce brand selling knitwear scales its daily budget from 500 USD to 2,500 USD inside an Advantage+ Shopping Campaign using stylized, color-saturated video ads. While Ads Manager reports a gross ROAS of 3.8x, the brand's physical return rate jumps from 14% to 39%. By replacing the stylized assets with unedited smartphone video showcasing genuine fabric drape under natural daylight, the brand realigns customer expectations, stabilizing returns despite the higher daily spend.
Why does my bank account shrink when Meta Ads Manager reports high ROAS?
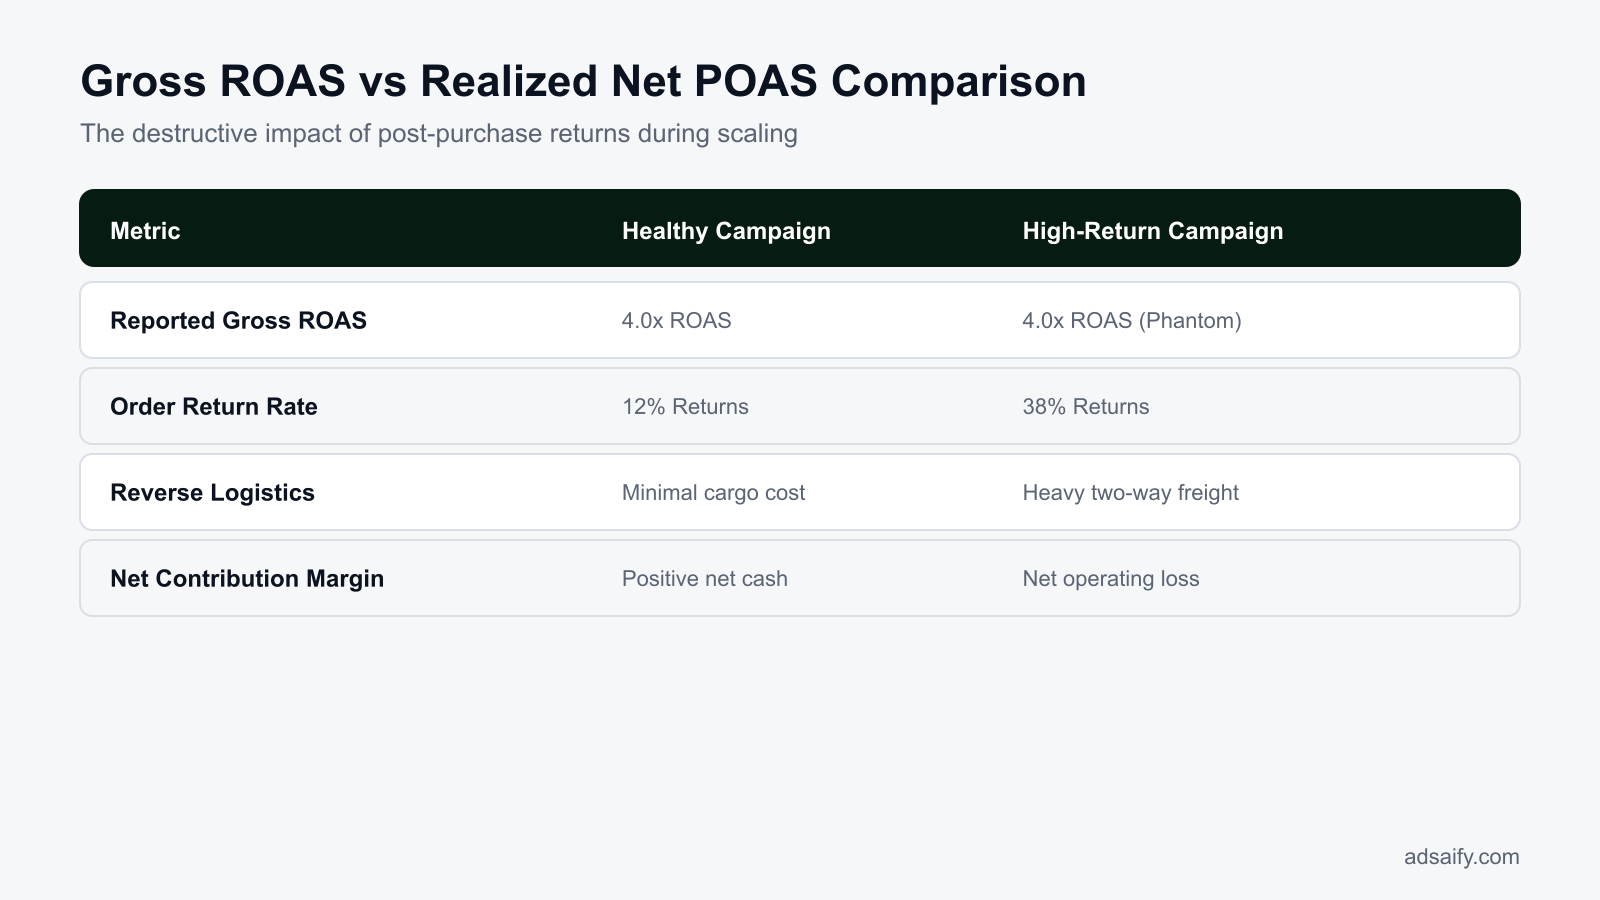
Your bank account shrinks because Meta Ads Manager measures gross sales value at the exact second of purchase, completely ignoring refund webhooks, restocking labor, credit card merchant fees, and non-refundable shipping charges. When returns climb at scale, you incur two-way transit fees and operational costs on phantom revenue. While your ad dashboard displays a profitable return on ad spend, your accounting ledger absorbs the cumulative losses of returned physical inventory and wasted customer acquisition spend.
Which metrics reveal that ad returns are eroding net profitability?
Ad returns erode net profitability when the gap between front-end gross sales and net realized revenue widens, two-way logistics fees overtake unit margins, and inventory carrying costs consume operating capital. Marketers expose this loss by auditing Net ROAS, POAS (profit on ad spend), net contribution margin per ad creative, and return rates grouped by campaign.
Divergence between gross front-end ROAS and net realized revenue
ROAS (return on ad spend) is gross revenue generated by an ad campaign divided by the total advertising spend. POAS (profit on ad spend) is net gross margin after product and fulfillment costs divided by ad spend. In Meta Ads Manager, standard reporting displays gross sales passed via pixel events. As scaling forces returns upward, front-end ROAS remains misleadingly high while merchant bank deposits drop. Performance teams must calculate Net ROAS by subtracting gross refund values from total pixel-reported revenue before dividing by ad spend.
Reverse logistics and negative contribution margins
Contribution margin is the revenue remaining from a sale after deducting all variable costs, including product costs, payment gateway fees, pick-and-pack labor, and shipping. High returns force brands to absorb both outbound delivery and return freight. When a business pays 6 USD outbound shipping and 6 USD return freight on a 40 USD order, these double freight expenses convert a seemingly profitable acquisition into a negative cash contribution.
Restocking overhead, damaged inventory, and unrecoverable stock
Returned products rarely return to warehouse shelves without friction. Inbound items require manual inspection, unboxing, sanitization, retagging, and repacking. Units damaged during transit or soiled by shoppers cannot be sold at full retail price, often requiring steep clearance markdowns or total liquidation write-offs that drain working capital.
| Metric | Ads Manager Visibility | Calculation Formula | Operational Risk Indicator |
|---|---|---|---|
| Gross ROAS | Native default column | Gross Pixel Revenue / Ad Spend | Overstates marketing performance during scaling |
| Net ROAS | Requires custom metrics or CRM | (Gross Revenue - Total Returns) / Ad Spend | Drops sharply while Gross ROAS stays flat |
| POAS | Unavailable inside Meta native UI | Gross Profit After Product Costs / Ad Spend | Falls below 1.0, signaling net operational losses |
| Net Contribution Margin | Unavailable inside Meta native UI | Net Revenue - COGS - Two-Way Freight - Ad Cost | Turns negative on high-volume scaling ad sets |
Marketers managing automated rules through Adsaify can set performance thresholds to pause underperforming ads before low net margins deplete overall campaign liquidity.
Is there an acceptable benchmark return rate for scaled e-commerce brands?
An acceptable return rate depends on the product category, but sustainable e-commerce brands generally maintain returns below 10% for non-apparel consumer goods and between 18% and 24% for scaled apparel brands. Exceeding a 30% return rate indicates severe friction in sizing, creative misrepresentation, or audience mismatch. Once returns cross 25%, reverse logistics and restocking expenses consistently erase front-end margin gains achieved through scaling ad spend.
What hidden costs emerge when high return rates are ignored at scale?
When brands ignore high return rates while scaling Meta ads, hidden costs erode business viability through unrecoverable two-way shipping fees, trapped inventory that misses peak selling windows, and restocking labor. Furthermore, Meta algorithms receive false purchase conversion signals, actively spending ad budgets to acquire more low-intent users who habitually return items.
Carrier Freight Penalties and Warehousing Overhead
Scaling ad spend without monitoring post-purchase retention amplifies reverse logistics costs. Reverse logistics is the supply chain process of moving goods from the end consumer back to the retailer or warehouse. Brands pay for the outbound label, carrier delivery surcharges, and the reverse shipping label when a customer initiates a return. In addition to direct shipping invoices, third-party logistics (3PL) providers charge intake, inspection, repackaging, and restocking fees for every returned SKU (stock keeping unit, a unique code identifying a specific product). If an item arrives damaged or without original tags, warehouse teams must liquidate or dispose of the product entirely, turning acquisition spend into a total capital loss.
Inventory Depletion and Algorithmic Misdirection
Fast-fashion and seasonal inventory caught in return transit creates phantom stockouts. A product reserved, shipped, returned, and re-inspected can remain tied up in transit limbo for 14 to 28 days. By the time that unit returns to sellable inventory, the peak promotional calendar or seasonal demand curve has frequently passed, forcing brands to apply heavy price markdowns.
Simultaneously, Meta ad optimization creates an expensive algorithmic trap. The Meta Pixel (a piece of code tracking website visitor actions) and Meta Conversions API (a server-side tool sharing web events directly with Meta) report standard Purchase events immediately at checkout. Meta Ads Manager measures performance against these unadjusted gross sales. The ad delivery system identifies demographic and behavioral commonalities among these buyers, then actively seeks identical users. When scaled, ad budgets are poured into targeting consumers prone to wardrobing or impulse-buying without intent to keep the merchandise.
- Audit monthly carrier invoices to separate reverse transit surcharges from primary delivery fees.
- Calculate average days in transit for returned goods to identify lost inventory turnaround cycles.
- Reconcile 3PL receiving logs to quantify unit depreciation caused by damaged packaging or missing tags.
- Deduct projected return deductions directly from gross average order values prior to setting bid caps.
- Establish automation rules in Adsaify to pause ad sets whose post-purchase return metrics breach profitability limits.
- Feed canceled and refunded orders back into Meta Conversions API to correct algorithmic learning signals.
How should logistics return costs be factored into daily ad spend calculations?
To factor logistics return costs into daily ad spend calculations, performance marketers must optimize for net ROAS (return on ad spend, calculated as net revenue after refunds divided by gross ad spend) rather than gross platform ROAS. Deduct outbound shipping, return freight labels, and 3PL restocking fees from your gross profit margin per order. This adjusted margin establishes a realistic break-even customer acquisition cost ceiling in Meta Ads Manager, ensuring scaling decisions rely on retained cash rather than inflated gross revenue.
How can brands determine if returns stem from product flaws or ad targeting?
Brands determine whether returns stem from product flaws or ad targeting by isolating return rates per ad creative, cross-referencing customer return reason codes, and comparing cold Meta acquisition cohorts against organic baseline cohorts. If return rates spike across all sales channels equally, the product is defective; if returns spike exclusively from specific ads, targeting or creative claims are misleading.
Analyzing Creative Angles Against Baseline Cohort Retention
Performance marketers must isolate variables by conducting a cohort analysis (a method of grouping customers based on shared acquisition timing and traffic sources). If organic repeat buyers and search-driven shoppers experience an 8% return rate on a specific dress, but cold audiences acquired via Meta ads return the exact same SKU at 34%, the product itself is not structurally defective. The issue lies in audience qualification or creative expectation management.
High return rates clustered around specific Meta ad creatives indicate misleading visuals or copy exaggeration. For instance, ads utilizing aggressive color grading, digital waist-cinching, or omitted fabric disclosures generate high click-through rates and cheap initial sales. However, when the consumer unboxes a garment that deviates from the video ad, buyer dissatisfaction triggers an immediate return merchandise authorization (RMA, the tracking mechanism used to approve product returns).
Deciphering Customer Return Reason Codes
Categorizing RMA reason codes provides immediate clarity on root causes. When customer feedback indicates structural sizing errors across all marketing channels, manufacturing patterns require recalibration. Conversely, subjective dissatisfaction reasons clustered under Meta attribution tags highlight weak audience qualification or over-promising copy angles.
| Customer Return Reason | Primary Problem Origin | Diagnostic Meta Metric | Required Performance Fix |
|---|---|---|---|
| Item does not match image or video | Ad creative exaggeration | High initial CTR, high refund rate | Replace filtered studio assets with accurate, unedited product videos |
| Fabric quality feels different than expected | Ad copy and value proposition | Low CPM, high 7-day refund rate | Disclose exact material compositions and weights in the primary ad copy |
| Ordered multiple sizes to find fit | Audience targeting and checkout UX | High average order value, 50% returns | Implement on-page sizing calculators and eliminate multi-size bundle incentives |
| Defective zipper, stitching, or seams | Product manufacturing flaw | Uniform return spike across all channels | Halt ad spend on SKU immediately and alert manufacturing quality control |
When drafting new campaigns, brands can use Adsaify to generate ad copy variations that clearly emphasize precise product specifications, helping set realistic customer expectations before checkout occurs.
How can I track return rates down to the specific ad creative in Meta?
To track return rates down to the specific ad creative in Meta, insert dynamic URL parameters containing Meta macro tokens (such as utm_content={{ad.name}} and utm_term={{ad.id}}) into the tracking field of every ad inside Meta Ads Manager. Pass these parameters into your e-commerce platform and order management software at checkout. Run a weekly cross-reference report joining RMA return tickets with UTM ad identifiers to calculate the exact return percentage generated by each creative asset.
If you would rather not set up each of these steps by hand, try it in Adsaify: your first ad is free, so there is nothing to lose. Create a free account.
What technical prerequisites prevent high returns before scaling spend?
Technical prerequisites prevent high returns by connecting post-purchase warehouse outcomes back to ad tracking systems and improving product data transparency before scaling budgets. Advertisers must feed granular attribution data into order management records, transmit refund signals back to Meta, and eliminate sizing guesswork directly on product detail pages.
Tracking returns down to the ad level with URL parameters
Scaling budgets without ad-level return tracking causes teams to allocate money toward creatives that generate high gross sales but negative net profits. Marketers must configure dynamic URL parameters in Meta Ads Manager under the Tracking section of each ad. Passing values such as utm_source=meta, utm_medium=cpc, utm_campaign={{campaign.name}}, utm_content={{ad.name}}, and utm_term={{adset.name}} into the destination URL allows e-commerce platforms like Shopify, WooCommerce, or custom enterprise resource planning (ERP) systems to store ad identifiers against specific order IDs. When a return or exchange occurs in the warehouse, the inventory management software maps the return back to the specific campaign, ad set, and creative that initiated the transaction.
Closing the feedback loop with Meta Conversions API
The Meta Conversions API (CAPI) is a server-side tool that sends web events and offline customer actions directly from a brand's server to Meta's ad delivery system. Most advertisers configure CAPI only to track standard web Purchase events, which trains Meta's algorithm to find users likely to buy regardless of whether they retain the item. By setting up custom offline event sets or server-side post-purchase events, brands can pass refund, return, or order cancellation data directly back to Meta Events Manager. While Meta does not offer a native standard "Refund" optimization goal for delivery, logging these events allows media buyers to build accurate custom reporting columns inside Ads Manager and calculate true customer acquisition costs.
Configuring product detail pages to eliminate purchase surprises
Ad traffic converts poorly on net margin when product detail pages (PDPs) leave fit, fabric weight, or proportions ambiguous. Before increasing ad spend, technical teams must integrate interactive sizing calculators that use biometric data, past brand purchases, and height-to-weight algorithms rather than static two-dimensional sizing charts. Furthermore, PDP media galleries must feature uncompressed, unedited macro video clips showing fabric elasticity, lining construction, and true daylight color to ensure user expectations match the unboxed physical order.
Technical audit checklist before scaling
- Append dynamic URL parameters to every active Meta ad creative under the Tracking settings.
- Map incoming UTM parameters to order line items inside the e-commerce database or ERP.
- Connect Meta Conversions API server-side endpoints to process backend order adjustments.
- Integrate an interactive, machine-learning-based sizing recommendation tool on PDP templates.
- Embed 4K macro video assets showcasing raw textile texture and stretch directly on product pages.
- Conduct end-to-end sandbox tests confirming that a simulated customer return registers against the original ad ID.
Is sending refund events through Conversions API technically mandatory?
Sending refund events through Conversions API is not technically mandatory to run Meta campaigns, because Meta's ad auction operates exclusively on standard web events like Purchase. However, ignoring server-side refund data blinds your attribution reporting. Transmitting refund events allows third-party business intelligence tools and internal analytics dashboards to calculate actual net margins by ad creative, ensuring you do not scale campaigns that produce unsustainable returns.
What step-by-step strategy lowers return rates while scaling Meta ads?
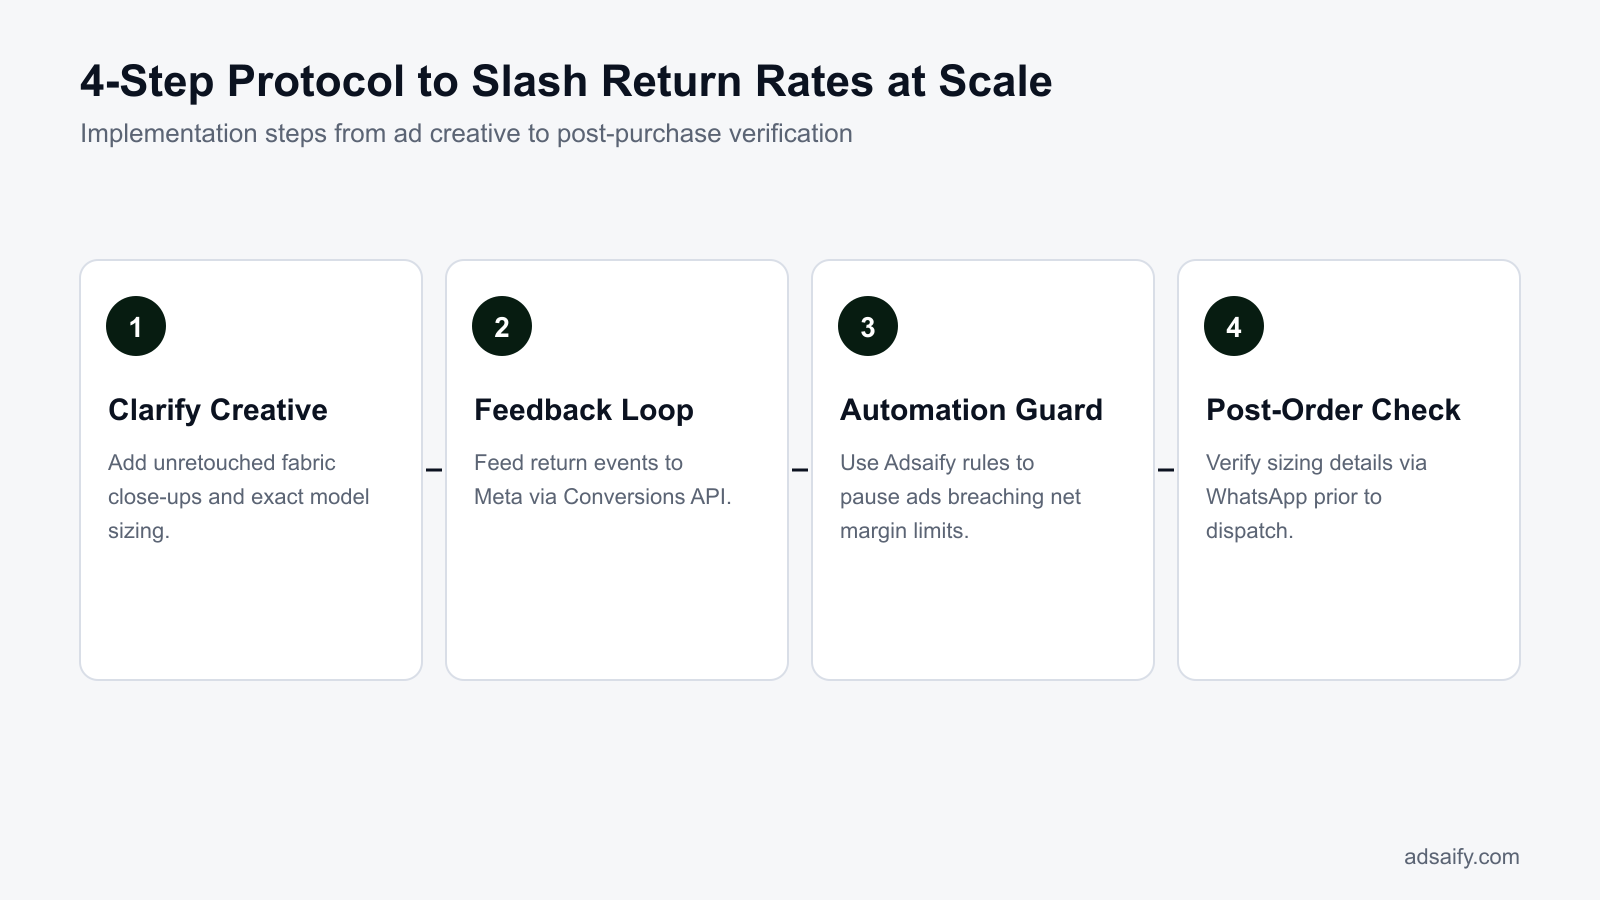
A step-by-step return reduction strategy lowers return rates by replacing exaggerated promotional messaging with realistic product demonstrations, filtering buyer remorse before dispatch, and automating budget reallocation away from high-return inventory. Aligning creative framing with post-purchase operations ensures that rising advertising spend attracts qualified buyers who intend to keep their purchases.
Shifting creative hooks from impulse discounts to utility
Aggressive discount promotions relying on urgency triggers, such as countdown timers and extreme percentage markdowns, attract impulse buyers who experience severe post-purchase cognitive dissonance. To stabilize returns during budget scaling, performance teams must transition copy frameworks inside Meta Ads Manager toward product utility, longevity, and specific use-case problem solving. Ad creative copy should clearly state material compositions, fit characteristics, and care instructions directly in the primary text. Inside video formats, media buyers should replace single-model studio renders with side-by-side comparison reels displaying multiple body types wearing varying sizes, alongside unretouched clips showing how the garment behaves under natural movement.
Automating SKU-level risk management and post-purchase filtering
Scaling ads on an apparel collection often surfaces individual stock keeping units (SKUs) that suffer disproportionate return volumes due to factory sizing discrepancies. Advertisers can implement rule-based monitoring to protect profit margins. POAS (profit on ad spend) is the net gross margin generated per dollar of ad spend after deducting product costs, shipping, and returns. By setting performance triggers, accounts can automatically throttle spend on ads promoting defective or high-return SKUs when net margin thresholds collapse. Simultaneously, customer relationship workflows should trigger an immediate email or SMS confirmation allowing buyers to adjust sizes or cancel misordered items within an operational processing window before package shipment.
Return mitigation execution workflow
- Creative audit — Identify top-spending Meta ads and remove misleading claims, extreme discount language, or aggressive urgency timers from primary text and overlays.
- Asset production — Produce split-screen video assets showing models of diverse body heights and weights wearing the product, proceeding to asset upload once verified against raw inventory.
- Rule integration — Set up automated rules to halt ad sets whenever return metrics drop profitability below target thresholds, passing management to monitoring teams.
- Fulfillment hold — Deploy an automated post-order hold system offering immediate size corrections before fulfillment teams print shipping labels.
- Net margin reconciliation — Compare returned unit volumes against campaign ad spend weekly to ensure only net-profitable campaigns receive budget expansions.
How can Adsaify help monitor and control campaigns driving unprofitable returns?
Adsaify allows media buyers to set automated rules that continuously monitor performance across your Meta ad account. When an ad set promotes a product catalog item that fails performance benchmarks or drains budget, Adsaify rules can automatically pause the underperforming ads. This automation prevents wasteful ad spend on items triggering buyer dissatisfaction, giving your team time to review product fit data before scaling further. You can build and test your first campaign by visiting the Adsaify registration page.
What worked example reduced apparel e-commerce returns from 38% to 18%?
An apparel brand reduced its return rate from 38% to 18% by removing misleading high-gross-ROAS creatives, embedding sizing specs directly onto video overlays, and pausing scale whenever warehouse return rates outpaced order volume. Aligning visual expectations before checkout protected bottom-line margins despite increased Meta ad spend.
Scaling ad spend while isolating return spikes
For example, an e-commerce retailer selling women's structured denim scaled daily spend from 1,500 TL to 8,000 TL inside Meta Ads Manager using Advantage campaign budget. As daily orders surged, the warehouse logged a sudden spike in physical returns two weeks later, climbing from a baseline of 20% to an unsustainable 38%. By tagging every ad creative with unique UTM campaign parameters, the brand cross-referenced return reasons inside their inventory management system against individual Meta ad creative IDs. This revealed that 70% of the returned inventory originated from a single top-of-funnel video ad.
Pruning deceptive gross ROAS winners
ROAS (return on ad spend) is gross revenue generated divided by ad spend. The offending denim ad boasted a 4.2 gross ROAS in Meta Ads Manager because heavy digital contrast filters made the rigid denim look like soft stretch jeggings. Customers bought rapidly at a low cost per acquisition, but returned the jeans immediately upon feeling the non-stretch fabric. The brand killed that specific high-gross ad variation completely. Using automated rule engines such as the rule builder in Adsaify, media buyers can automate pausing ad sets when specific efficiency thresholds fail, preventing runaway spend on deceptive winners.
Overhauling creative overlays with sizing metadata
To eliminate mismatched customer expectations, the brand produced new creative assets displaying physical specification overlays directly in the first three seconds of video reels:
- Fit specifications: "Model is 174 cm, 58 kg, wearing size S."
- Fabric elasticity: "Zero stretch, 100% rigid cotton denim."
- Sizing warning: "Tight waistband; if between sizes, choose one size up."
Within two weeks of deploying these transparent creatives, reverse shipping courier invoices dropped by half. Even though front-end gross ROAS dipped slightly from 4.2 to 3.4 inside Meta Ads Manager, net retained revenue expanded significantly because the post-purchase return rate collapsed from 38% down to 18%.
Can this framework apply identically to product categories outside of fashion?
Yes, this framework applies directly to consumer electronics, home furnishings, and cosmetic skincare. In non-apparel categories, high return rates usually stem from mismatched dimensions, unstated setup requirements, or unrealistic visual promises rather than garment fit. Displaying true physical measurements, power connectivity constraints, and unedited product finishes directly inside Meta video overlays prevents buyer remorse. Eliminating ads that generate inflated gross conversion rates through visual deception protects net profit margins across every physical e-commerce vertical.
How can brands verify that their return reduction strategy succeeded?
Brands verify that a return reduction strategy succeeded by tracking net profit on ad spend across cold traffic cohorts, confirming a decreasing ratio of carrier return fees against gross order volume, and recording a downward trend in 14-day cancellation and delivery refusal rates.
Tracking realized net POAS instead of front-end Meta metrics
POAS (profit on ad spend) is net profit generated divided by ad spend. Unlike gross ROAS reported inside Meta Ads Manager, realized net POAS deducts the cost of goods sold, outbound shipping, return processing labor, and reverse courier fees. A successful return mitigation campaign shows steady upward growth in net POAS 30 days after customer acquisition, proving that retained revenue is rising even if the front-end cost per purchase remains flat.
Auditing carrier invoices and early friction indicators
Verification requires reconciling Meta ad cohorts against external logistical indicators rather than relying solely on pixel data. Brands should measure the exact proportion of reverse logistics invoices sent by shipping carriers relative to total outbound parcel volume. Additionally, brands must monitor immediate friction signals within 14 days of purchase, specifically customer support order cancellation requests and courier delivery refusals at the doorstep.
| Verification Signal | Pre-Optimization Symptom | Post-Optimization Metric | Data Source to Audit |
|---|---|---|---|
| Realized Net POAS | Under 1.1 with negative cash flow | Over 1.8 with positive retained profit | Internal ERP or profit spreadsheet |
| Reverse Logistics Invoices | Exceeding 25% of total freight costs | Below 10% of total freight costs | Shipping carrier monthly billing |
| 14-Day Delivery Refusals | Refusal rate climbing above 8% | Refusal rate dropping under 2% | Courier tracking management portal |
| Ad-Level Return Margin | 4.0+ gross ROAS yielding net losses | 3.0 gross ROAS yielding healthy profit | Order management tagged with UTMs |
When launching fresh creative iterations through automated campaign management platforms like Adsaify, brands can continuously test clearer messaging against cold audiences while maintaining tight control over active ad spend distribution across proven styles.
How many days of attribution lag are needed to confirm a real drop in returns?
Brands require a minimum attribution lag window of 21 to 30 days to confirm a legitimate drop in returns. Most e-commerce return policies grant consumers a 14-day to 30-day window to ship products back after arrival. Auditing performance after only seven days creates false confidence, because courier delivery times, customer trial periods, and reverse transit timelines delay the real data from appearing inside logistics reports.
Want to see this in your own account? Enter your website address and Adsaify drafts the campaign for you. The first ad is free. Try it now or log in.
What weekly routine ensures return spikes do not recur during scaling?
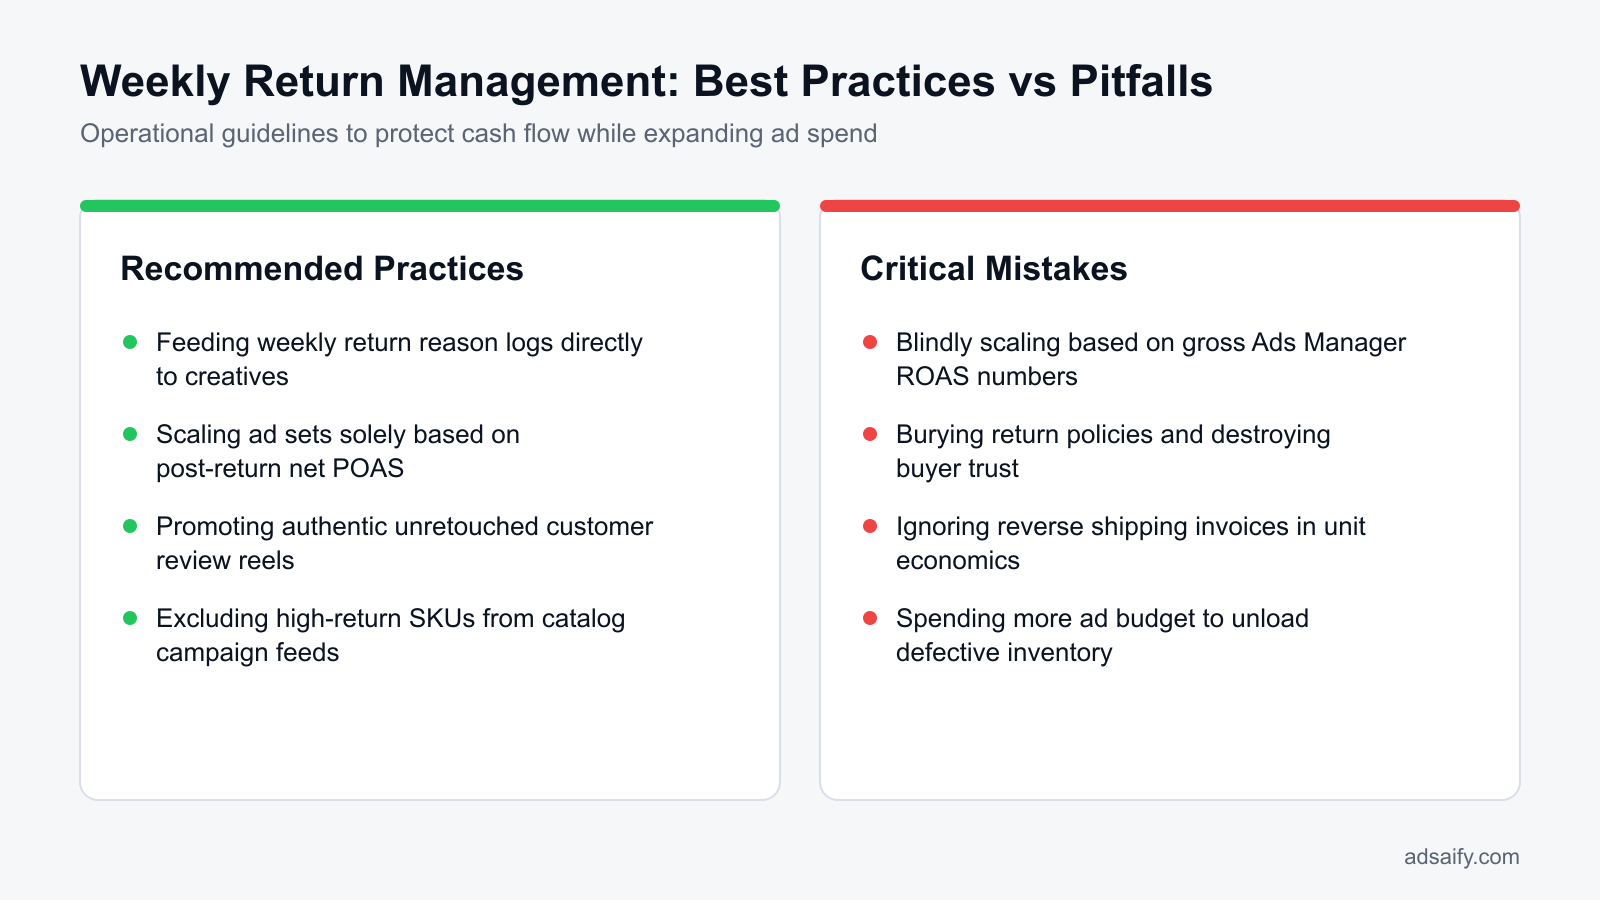
A weekly routine prevents return spikes during scaling by auditing SKU-level refunds against active ad angles on Mondays, pruning misleading creatives and poor-fitting variants on Wednesdays, and validating offline refund data in Meta Events Manager on Fridays. This disciplined cadence identifies disconnects between customer expectations and delivered goods before ad budgets compound return losses.
Structuring the weekly feedback loop between logistics and Meta Ads Manager
Scaling ad budgets amplifies minor operational blind spots into severe margin loss. E-commerce brands running Meta ads must coordinate warehouse returns, customer service feedback, and ad account operations on a recurring schedule. Media buyers should review performance in Meta Ads Manager alongside inventory reports rather than evaluating campaign return on ad spend in isolation.
- Daily: Monitor warehouse return intake logs and flag any sudden SKU-level volume spikes to the media buying team immediately.
- Weekly on Monday: Export order refund data by SKU from your e-commerce platform and map each high-return product back to specific ad IDs in Meta Ads Manager.
- Weekly on Tuesday: Audit customer support refund tickets to tag whether returns stem from deceptive ad visuals, inaccurate sizing charts, or color distortions.
- Weekly on Wednesday: Prune out-of-spec product variants from Meta Catalog product feeds and pause individual ad creatives that generate higher return rates than account baselines. Automated rules inside platforms like Adsaify can pause ads that cross defined cost-per-acquisition or efficiency thresholds.
- Weekly on Thursday: Update landing page copy, sizing tables, and product disclaimers for active scaling campaigns to address specific complaints recorded earlier in the week.
- Weekly on Friday: Inspect Meta Events Manager to verify that offline purchase and refund events sent via the Meta Conversions API (a server-to-server data connection) match incoming logistics data without sync drops.
- Monthly: Recalculate net ad profitability across all scaling campaigns to subtract reverse logistics fees and restocking losses before establishing the next monthly creative production budget.
What is the first operational action if a specific ad's returns spike mid-week?
The immediate operational action is to pause the individual ad creative inside Meta Ads Manager rather than shutting down the entire ad set or campaign. Pausing the single misleading ad stops the influx of mismatched customer expectations immediately while preserving accumulated delivery learning on stable ads within the ad set. Once paused, cross-reference the ad copy and visuals against customer service refund feedback to determine whether the creative made exaggerated claims or presented an inaccurate representation of the product.
What common mistakes occur when attempting to suppress ad return rates?
Common mistakes when suppressing ad return rates include over-restricting return windows, compensating media buyers on gross revenue rather than net profit, blaming product manufacturing for deceptive ad copy, and pausing entire campaigns instead of specific assets. These reactive missteps degrade customer trust and suppress front-end conversion rates without curing the underlying causes of post-purchase dissatisfaction.
Tightening return policies so severely that first-time buyer conversion collapses
Shortening return windows or charging excessive restocking fees penalizes legitimate customers. While total returns may drop numerically, front-end store conversion rate collapses because hesitant first-time shoppers abandon checkout when faced with restrictive terms. The correct approach is clarifying product measurements and materials upfront on the product page rather than erecting hostile post-purchase barriers.
Incentivizing media buyers on gross revenue instead of net contribution profit
Gross ROAS (return on ad spend, defined as total tracked purchase revenue divided by ad spend) encourages media buyers to scale aggressive, clickbait creatives that generate rapid sales but massive refund rates. Evaluating media buyers on gross revenue masks capital erosion. The fix is tying performance targets to net ROAS, which subtracts refunds, processing fees, and reverse logistics costs from gross ad revenue.
Assuming product manufacturing faults while ignoring misleading creative claims
Brands often demand factory re-inspections when returns climb, overlooking that their video ads used saturated filters or exaggerated fabric flexibility. When the delivered product fails to match the stylized ad presentation, customers return it. The fix is auditing video ads frame by frame against the physical merchandise to ensure color balance and product demonstrations reflect reality.
Pausing entire scaling campaigns instead of isolating offending ad creatives
Shutting off an entire campaign in Meta Ads Manager when refunds increase resets algorithmic machine learning and damages account delivery efficiency. The fix is inspecting breakdown reports by ad creative, then pausing only the specific asset driving low customer satisfaction using manual controls or automation rules in tools like Adsaify.
Hiding detailed sizing charts and fit limitations to maximize front-end clicks
Marketing teams sometimes minimize fit warnings or fabric stiffness notices fearing it will reduce immediate checkout completions. This practice induces multi-size purchases destined for return. The fix is embedding clear fit indicators, height references, and model measurements directly above the purchase button.
Neglecting to feed refund and return data back into Meta Events Manager
Optimizing delivery exclusively on purchase events causes Meta algorithms to find more high-intent buyers who happen to return products frequently. The fix is transmitting server-side refund events via the Meta Conversions API, training Meta delivery systems to avoid refund-prone audience segments.
How much does tightening return conditions damage upfront ad conversion rates?
Restricting return policies typically reduces upfront e-commerce conversion rates by 15% to 35%, depending on the vertical. When prospective customers see non-refundable terms, short return windows under fourteen days, or customer-paid return shipping fees, perceived purchase risk spikes dramatically. This friction causes potential buyers to abandon carts, driving up Meta cost per acquisition (CPA) far more than the financial savings gained from preventing returned merchandise.
When does ad optimization fail to resolve high e-commerce return rates?
Ad optimization fails to resolve high e-commerce return rates when the root cause originates outside marketing control, specifically within product manufacturing, operational fulfillment, or competitive marketplace pricing. Adjusting Meta ad targeting, copy, or creative cannot correct physical garment defects, broken transit promises, or post-purchase buyer regret caused by cheaper identical listings found elsewhere.
Inherent Product Defects, Pattern Flaws, and Material Degradation
Meta Ads Manager provides optimization toggles such as Value Optimization and Conversion Leads, but these algorithms operate on the assumption that the underlying merchandise satisfies standard consumer expectations. When an apparel factory produces inconsistent sizing grading—for instance, where a labeled medium measures as an extra-small across the chest—even the most accurate creative depiction results in returns. Substandard materials that shed, wrinkle excessively during shipment, or produce chemical odors straight out of the poly mailer trigger immediate return requests regardless of the audience accuracy configured in your Advantage+ audience settings. When return feedback consistently cites poor stitching, broken zippers, or fabric transparency, marketing interventions must yield to physical product audits and inventory re-engineering.
Fulfillment Bottlenecks and Carrier Delivery Delays
Scaling spend on Meta platforms frequently outpaces the operational throughput of standard warehouse dispatch and third-party logistics (3PL) partners. When daily order volumes surge from 50 to 500 packages, pick-and-pack queues stretch from 24 hours to multiple days. In modern e-commerce, extended delivery times directly inflate order rejection rates at the doorstep, particularly in regions that utilize cash-on-delivery or fast-fashion delivery expectations. If a customer purchases a dress for an upcoming weekend event, an unannounced five-day fulfillment delay eliminates the utility of the purchase. The customer either refuses the parcel upon arrival or initiates a return label immediately upon receipt because the intended event has already passed.
Post-Purchase Price Discovery and Marketplace Undercutting
Algorithmic ad scaling surfaces products to impulse buyers who convert rapidly on visually captivating Meta creatives. However, high-velocity ad visibility also alerts automated scrapers and competing merchants across marketplace platforms like Amazon, Temu, or Google Shopping. When shoppers encounter identical or white-labeled alternatives at lower price points during the shipping transit window, buyer remorse intensifies. Customers deliberately order the cheaper alternative and return the original brand parcel unopened. No demographic targeting adjustment, creative revision, or exclusion list in Meta Ads Manager can offset a pricing disparity where identical inventory is readily accessible elsewhere for less money.
Audit your supply chain and operational pipeline against this checklist before attempting to fix return spikes inside your ad account:
- Inspect incoming production batches against strict physical size-spec tolerance sheets.
- Audit warehouse dispatch logs to ensure same-day or 24-hour fulfillment velocity.
- Benchmark competitive marketplace pricing weekly for identical or heavily imitated SKUs.
- Review customer return reason codes inside your warehouse management software (WMS).
- Establish automated tracking notifications via SMS and email to maintain delivery expectations.
- Verify wash-and-wear durability on sample garments prior to allocating paid ad spend.
How can I tell whether returns stem from delivery delays or ad messaging?
Cross-reference your warehouse dispatch and courier transit timestamps against return initiation dates in your returns management portal. If return rates spike predominantly on orders requiring more than four business days to deliver, transit latency is the culprit. Conversely, if fast-delivered orders exhibit high return rates with return reason codes citing incorrect fit, unexpected color variance, or misleading material expectations, your Meta ad creative, size guides, or ad copywriting generated inaccurate buyer expectations.
What key terminology defines return management and net ad profitability?
Return management and net ad profitability terminology defines the financial, operational, and algorithmic metrics required to measure realized e-commerce earnings after customer returns. Standard ad platform metrics calculate performance at the immediate point of sale, making specialized terminology necessary to isolate true profit, reverse logistics expenses, and post-purchase revenue erosion accurately.
- POAS (Profit on Ad Spend): The financial ratio of net gross profit generated per monetary unit spent on paid advertising, calculated by dividing realized gross profit by total ad spend.
- Reverse Logistics: The end-to-end operational workflow, return shipping freight fees, warehouse inspection processes, and restocking procedures required to handle returned merchandise.
- Phantom ROAS: An artificially inflated return on ad spend metric displayed in Meta Ads Manager that counts upfront purchase revenue before customer cancellations and post-purchase returns occur.
- Net Contribution Margin: The realized operating profit remaining from net sales revenue after deducting the cost of goods sold, payment processing fees, shipping costs, pick-and-pack expenses, ad spend, and return handling fees.
- Gross Return Rate: The percentage of sold merchandise units or total revenue that customers send back to the warehouse for a refund or store credit.
- Restocking Depreciation: The reduction in an item's resale value caused by opened packaging, missing tags, handling transit damage, or seasonal obsolescence during the return cycle.
- First-Party Margin: The direct profit margin calculated strictly on inventory cost versus selling price, excluding variable platform fees, customer acquisition costs, and reverse logistics overhead.
- Return Reason Code: A standardized data classification assigned during the return request process that categorizes why a buyer rejected a product, such as incorrect sizing, defective stitching, or delayed delivery.
- Cohort Return Curve: A tracking model that plots return request frequency over a specific 30-day, 60-day, or 90-day timeline following the original purchase date to measure return stabilization.
- Break-Even ROAS: The exact point-of-sale ROAS figure required for an advertising campaign to yield zero net profit after subtracting all production, fulfillment, and return overhead.
- Post-Purchase Drop-Off: The proportion of processed e-commerce transactions that are canceled prior to courier dispatch or rejected directly at the doorstep by the recipient.
Which ad panel variables must be combined to calculate true realized POAS?
To calculate true realized POAS, export the Amount Spent metric directly from Meta Ads Manager and combine it with verified data from your enterprise resource planning (ERP) or e-commerce backend. Take the total gross sales generated by the corresponding ad attribution window, subtract refunded order values, subtract reverse logistics and restocking charges, and subtract the actual cost of goods sold (COGS). Divide this final retained gross profit figure by the Amount Spent recorded in the Meta Ads Manager panel.
How can e-commerce brands scale Meta ad spend while safeguarding net cash?
To keep return rates manageable while scaling Meta ads, first audit creatives to display precise sizing, fabric, and usage expectations. Next, feed refund and cancellation signals back into your Meta Conversions API or track net-ROAS in your reporting rather than gross revenue. Finally, configure automated rules to pause or adjust campaigns promoting items that breach your acceptable return threshold.
Review your top three bestselling products by ad spend today and calculate their net margin after accounting for returns over the past thirty days. If any product exceeds your acceptable return threshold, immediately update its creative assets with explicit product specs, and consider setting up automation rules in tools like Adsaify to monitor and pause underperforming ad campaigns automatically.
Want to see this in your own account? Enter your website address and Adsaify drafts the campaign for you. The first ad is free. Try it now or log in.
Frequently Asked Questions (FAQ)
1. What is considered a normal and acceptable return rate when scaling Meta ads?
A normal return rate typically varies by vertical; for example, apparel often sees returns between 15% and 30%, whereas consumer electronics generally stay below 10%. When scaling Meta ads, an acceptable return rate is any rate where net profit remains sustainable after accounting for reverse logistics and restocking costs. If returns exceed category norms, your ads likely misrepresent product attributes.
2. How does feeding refund data to Meta Pixel train the ad delivery algorithm?
Meta's delivery algorithm optimizes toward users who resemble past purchasers. When you pass refund or return events back through the Meta Conversions API or offline events, the system deducts those transaction values from conversion optimization models. This signals to Meta that buyers with high refund propensities provide lower customer lifetime value, shifting delivery away from similar audiences toward higher-intent, retention-friendly shoppers.
3. Does showing explicit sizing and fabric details decrease ad click-through rates?
Showing explicit sizing, material specs, or fit details may slightly reduce overall click-through rates, but it significantly improves purchase quality. CTR (click-through rate is the ratio of ad clicks to total impressions) drops because uninterested or misfitting shoppers self-select out. However, on-site conversion rates increase, and post-purchase return rates decrease because clicking visitors already understand the true specifications of the product.
4. Does disabling cash-on-delivery hurt total sales volume when scaling ads?
Disabling cash-on-delivery (COD) often reduces gross order volume because it removes friction for impulse shoppers. However, COD orders typically experience much higher cancellation and return-to-origin rates than prepaid transactions. Removing COD usually stabilizes net profit, lowers shipping and fulfillment losses, and prevents ad budgets from being wasted on generating orders that are never collected or paid for.
5. Can Adsaify automatically pause ad campaigns promoting high-return products?
Adsaify provides automation rules that can pause ads based on performance metrics inside your Meta ad account. While Adsaify does not directly track physical inventory returns or warehouse logistics, you can set rules to automatically pause campaigns or ad sets when ROAS drops below a chosen net profitability threshold, preventing continued ad spend on products that generate unprofitable, return-heavy traffic.
6. How much should you increase the budget of an ad that remains profitable after returns?
When scaling an ad that remains profitable after factoring in returns, increase the ad set or campaign budget by 15% to 20% every two to three days. Incremental scaling prevents Meta's delivery algorithm from resetting into an erratic learning phase. Monitor net-ROAS (net return on ad spend after refunds) for 48 hours before applying another budget increase to ensure profitability holds.
7. How can post-return customer surveys serve as direct inputs for ad optimization?
Post-return surveys reveal exact customer dissatisfaction patterns, such as inaccurate sizing, misleading colors, or confusing functionality. E-commerce marketers can use these survey responses to adjust ad copy and creative assets directly. For instance, if customers report a shoe runs small, you can update ad copy to recommend sizing up, preventing future buyers from ordering the wrong size from the start.
8. Does faster fulfillment and delivery directly reduce return rates from Meta ads?
Yes, faster fulfillment and delivery directly reduce return rates, especially for impulse purchases generated by Meta ads. Buyers who wait extended periods often experience buyer's remorse or purchase alternatives locally, leading to order cancellations and package rejections. Delivering orders promptly reinforces purchase intent, limits the window for customer regret, and noticeably improves delivery acceptance rates across scaled campaigns.
How can you try this with Adsaify?
The quickest way to apply the steps in this article to your own account is to try them. Adsaify analyses your business from your website address, drafts the campaign with an audience, ad copy, creative and a budget suggestion, and publishes it to your own Meta ad account once you approve.
- Your first ad is free: there is nothing to lose by trying.
- Your own ad account: the campaign runs in your Meta account and you stay in control.
- Images and video: generate ad creatives with AI or promote an existing Instagram post.
Create a free account and try your first ad · Already have an account? Log in.